This curriculum introduces students in grades 9 – 14 to core Artificial Intelligence concepts through real-world applications in Environmental Science. The course combines foundational AI principles with hands-on Python coding labs.
Students will:
- Understand the essential knowledge in AI and apply them to real-world challenges
- Build confidence through practical, project-based learning
- Learn responsible AI practices
- Explore how AI can create positive social impact
Using climate change as the central theme, students will identify real-world problems, select appropriate AI methods, and evaluate model performance using data and machine learning metrics.
Prerequisite: Basic Python programming
Target Audience: Grades 9 – 14 students
Session #1 Introduction to AI in Climate Science
[40 minutes Instruction] Applications of AI in climate science
[10 minutes] Understanding Climate Change and its Impacts
Climate change is one of the biggest challenges that human society is facing now. The increasing extreme climate hazards such as heatwaves, flood and wildfires cost lives, damages citizens’ properties and public infrastructures. Watch this expert-led video from Oxford University’s Department of Physics for an overview of climate impacts and how AI can help address them.
[10 minutes] The Data-to-Decision Value Chain in Climate Science
Climate change is a complex, multi-layered challenge requiring observation systems (sensors and satellites), large-scale data storage, advanced analytics, predictive models, policy frameworks, and coordinated action. To structure this process, the IPCC describes a data-to-decision value chain. We begin by understanding this chain, then explore how AI supports each stage.
| Stage | Description | Example |
|---|---|---|
| Observation Layer | Collect raw Earth system data | Satellites, ground sensors |
| Modeling / Analytics Layer | Convert data into interpretable indicators | CO₂ emission, temperature, rainfall |
| Impact & Risk Assessment Layer | Estimate hazards and probabilities | Flood, heatwave, drought risk |
| Decision & Policy Layer | Translate insights into action | Emission controls, adaptation planning |
| Outcome Layer | Real-world societal and environmental benefits | Reduced emissions, improved resilience |
| Analytical Reports | Synthesize evidence for planning and governance | IPCC reports, NDCs, NAPs, IAM scenarios |
[20 minutes] AI Applications in Climate Science
AI can help with monitoring, what-if analysis to suggest actions, and synthesizing complex information to communicate across experts in different domains. Here are applications currently available online:
- Climate TRACE uses satellite data and AI to track greenhouse gas emissions from hundreds of thousands of sources worldwide, from power plants to farms, broken down by country, city, or individual facility. It also helps experts estimate how much emissions could be cut by taking specific actions.
- Carbon Mapper uses satellites and aircraft to detect and pinpoint facilities leaking unusually large amounts of methane or CO₂. Its public data portal helps governments, regulators, and companies identify where the biggest fixes are needed and take direct action.
- Google’s Heat Resilience tool helps city planners test different cooling strategies, such as planting trees or installing cool roofs, before committing resources, by showing where each approach would have the greatest impact on temperature and public health.
- ChatClimate lets anyone ask questions about climate risk in plain language, with answers grounded in the latest IPCC reports. It helps bridge the gap between climate scientists and professionals in fields like finance, urban planning, or policy who need to act on that knowledge.
Session #2 Foundations of AI and Machine Learning
[40 minutes Instruction] Essential AI and machine learning concepts
[7 minutes] Perception of AI Systems
In climate science, computers “sense” the world through satellites and ground-based sensors, collecting imagery and environmental measurements (e.g., temperature, gases, land surface data).
[8 minutes] Representation
AI converts raw data into numerical forms such as features and embeddings. Features describe specific properties (e.g., vegetation index), while embeddings act like compact summaries capturing overall patterns and similarities.
[15 minutes] Learning
Students are introduced to supervised learning (using labeled examples), unsupervised learning (discovering patterns without labels), and reinforcement learning (learning through feedback and rewards), with examples tied to environmental analysis.
[5 minutes] Natural Language Interaction
Large Language Models (LLMs) enable interaction with AI systems using everyday language, supporting tasks like querying datasets, explaining results, or exploring scientific reports.
[10 minutes] Responsible AI Considerations
AI predictions are probabilistic and subject to uncertainty. Key concepts include precision, recall, bias and explainability.
Session #3 Land Cover Discovery from Satellite Imagery
[60 minutes Lab] Exploring perception, representation, learning, and evaluation metrics
Understanding crop type distribution is important for climate research, food security analysis, water resource management, and sustainability planning. Because detailed crop maps like the USDA NASS Cropland Data Layer (CDL) are only available for the United States, this session highlights how AI can help bridge geographic data gaps. By using embeddings and the K-Nearest Neighbor (KNN) algorithm, students see how machine learning models trained on U.S. data can generalize to other regions.
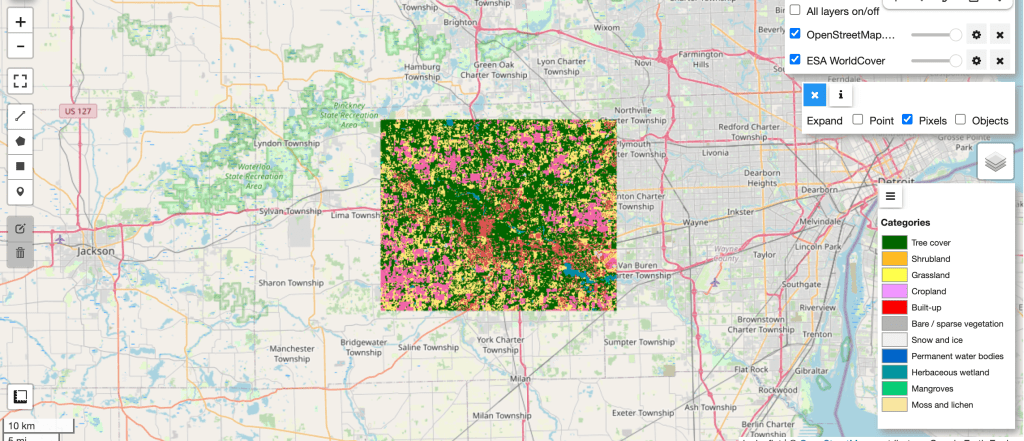
[5 minutes] Explain: Feature Representation (ESA WorldCover Example)
Explain feature-based representation using ESA WorldCover, where each pixel encodes land cover classes (e.g., built-up, forest, water, cropland).
[7 minutes] Demo: Visualizing ESA WorldCover in Colab
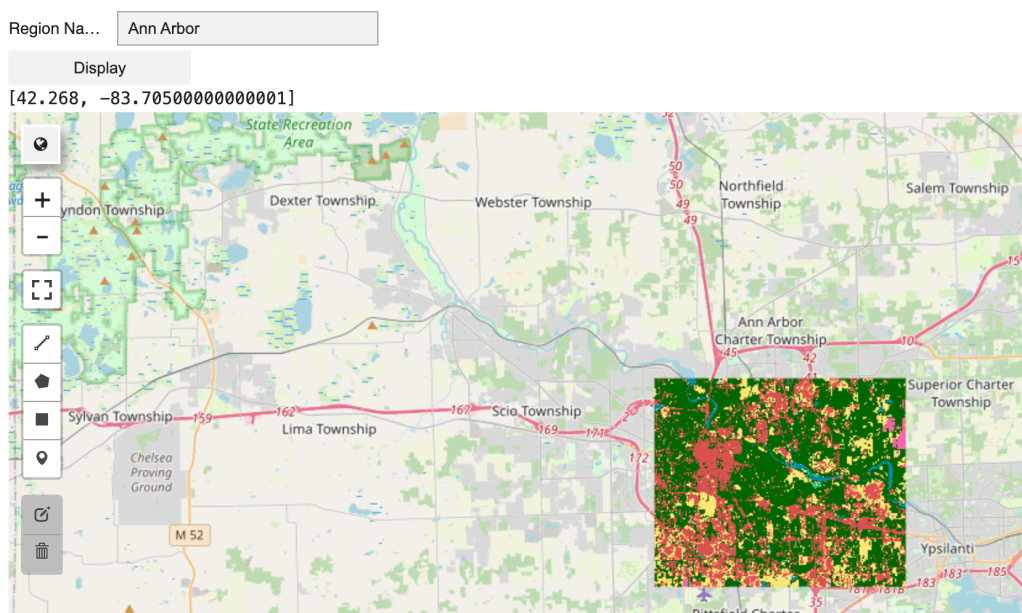
Display land cover categories for Ann Arbor as a colored layer on the map and interpret the class labels.
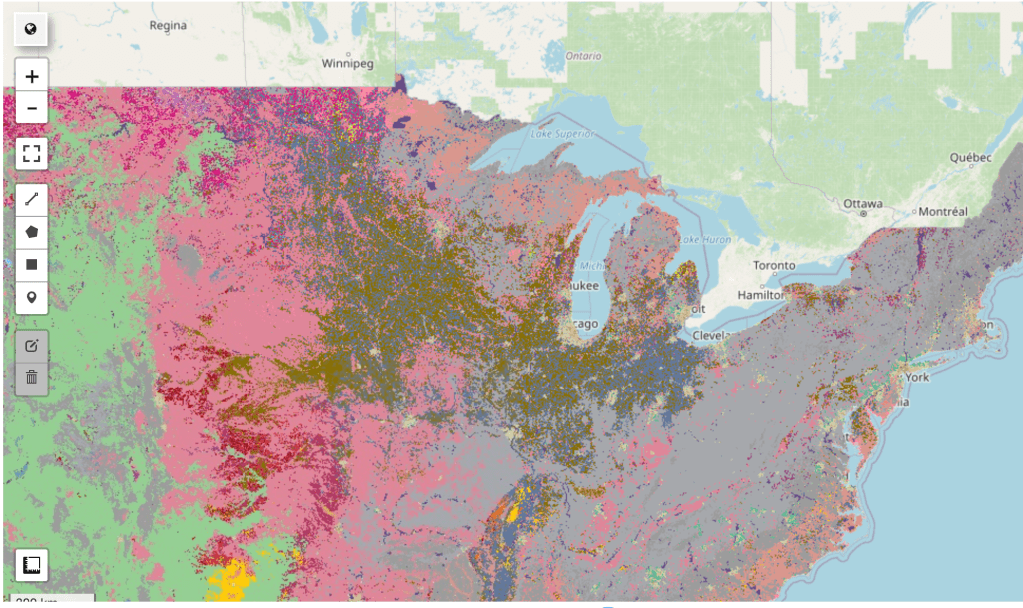
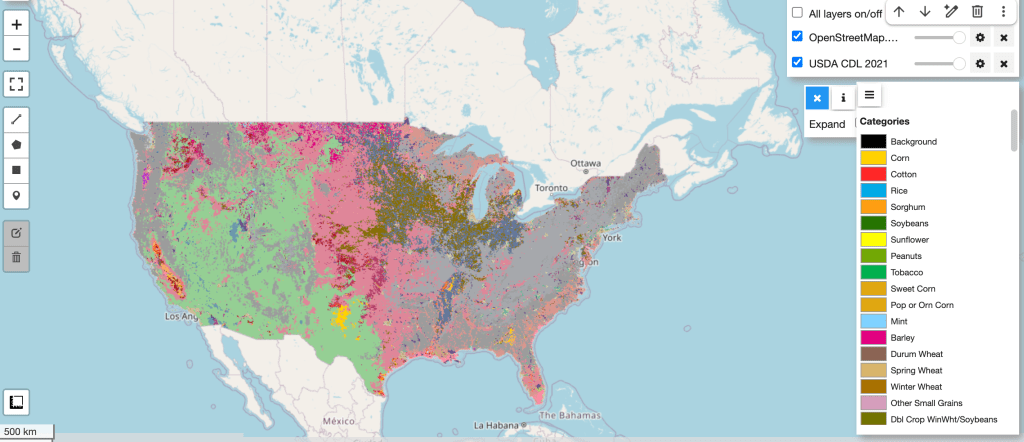
[5 minutes] Demo: Explore U.S. Cropland Data Layer (CDL)
Examine how the USDA NASS CDL dataset provides detailed, pixel-level crop type classifications across the United States, including crops such as corn, soybeans, wheat, and cotton.
[5 minutes] Explain: Embedding Representation (Alpha Earth Embeddings)
Introduce embeddings as compact numerical vectors that summarize the semantic characteristics of imagery. Explain that instead of using raw pixels, AI models encode each image or location into a list of numbers capturing patterns such as texture, vegetation, and land structure. Similar landscapes produce similar embeddings, enabling comparison, clustering, and machine learning tasks like classification.
[5 minutes] Demo: Extracting Embeddings by Coordinates
Show how to retrieve Alpha Earth embeddings for selected geographic locations in Colab.
[10 minutes] Explain: Extending Beyond the U.S. with Machine Learning (KNN)
Since detailed crop type labels (CDL) are only available for the U.S., we use Alpha Earth embeddings and the KNN algorithm to generalize and predict crop types in regions outside the U.S. Explain how KNN classifies a location by comparing its embedding to the most similar labeled examples and assigning the majority crop type among its nearest neighbors.
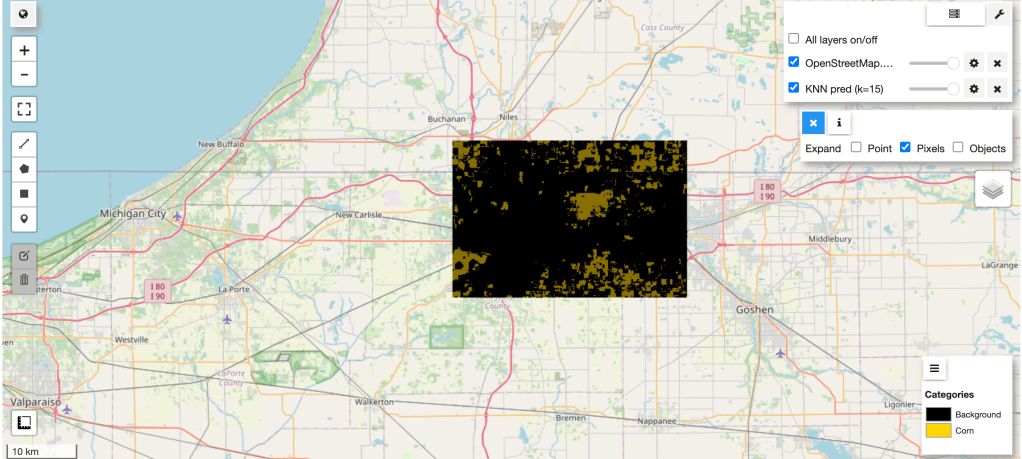
[8 minutes] Demo: KNN Binary Classification (Corn vs. Not Corn)
Train the KNN model in Colab using USDA NASS CDL data from Ann Arbor, MI, then test and visualize predictions for South Bend, IN.
[10 minutes] Explain and Demo: Model Evaluation Metrics
Explain and demo accuracy, precision, and recall in the context of crop detection.
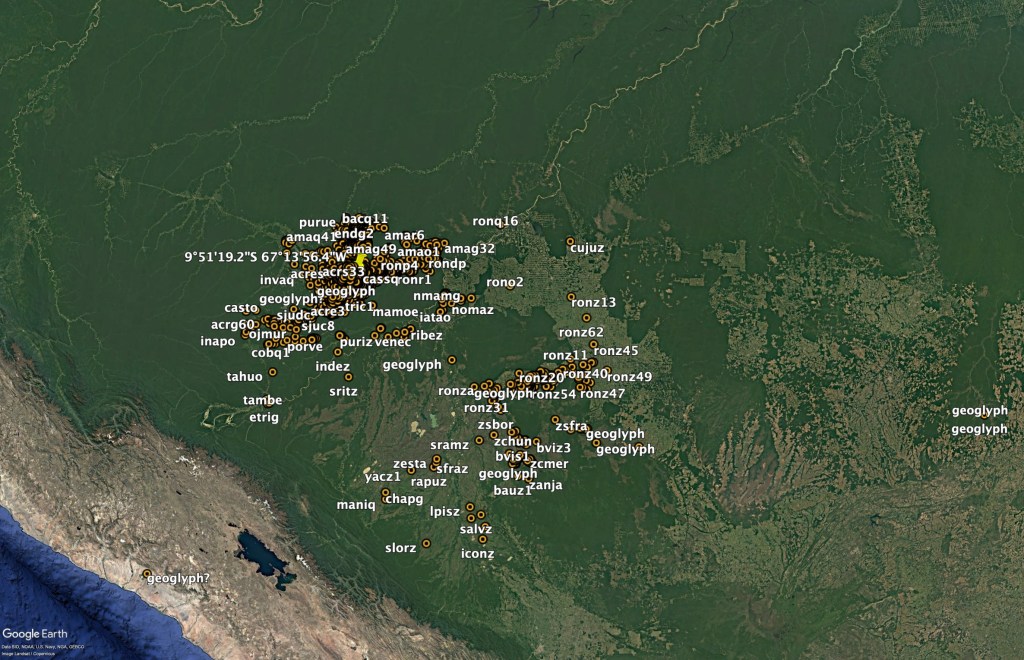
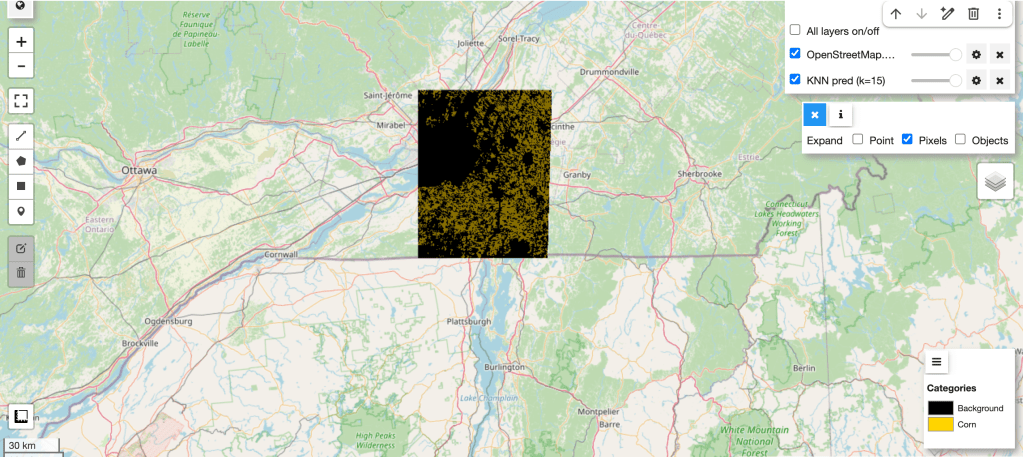
[5 minutes] Demo: Inferencing Outside the U.S.
Apply the trained KNN model to Southern Ontario, Canada, demonstrating how the model extends detailed crop classification beyond the U.S.
Homework: Build a prediction model to identify a different crop type
Session #4 Interacting with Satellite Imagery Using Generative AI
[40 minutes Lab] Natural language interaction & Responsible AI considerations
In this session, students will explore how to design interactive user experience experiments in Colab and how Generative AI can enable more natural human-computer interaction.
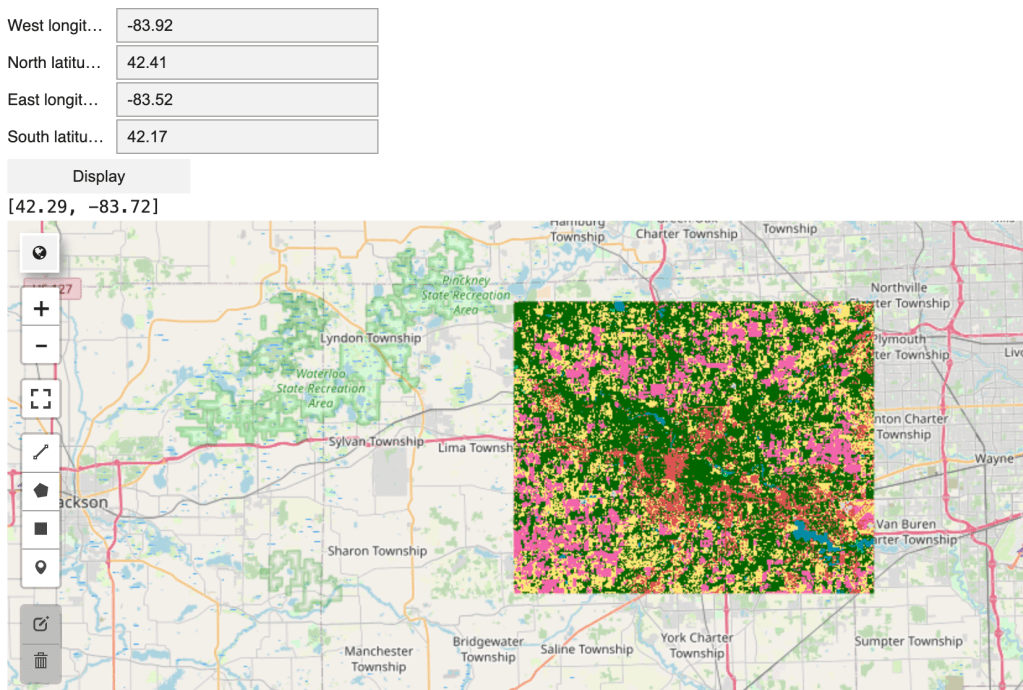
[10 minutes] Demo: Interactive User Experience in Colab
Create coordinate input widgets (float values) in Colab. Upon clicking the display button, visualize land cover categories from ESA WorldCover dataset as a colored map layer for the selected location.
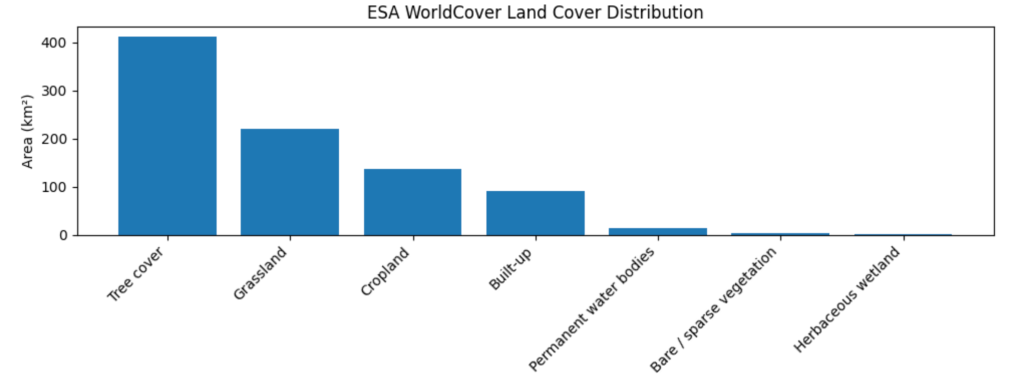
[10 minutes] Demo: Visualizing Land Cover Distribution
Display a bar chart summarizing land cover categories by area (km²), such as tree cover, grassland, and cropland, to improve interpretability.
[10 minutes] Demo and Explain: Natural Language Interaction for Land Cover Queries
Explain that entering latitude and longitude coordinates can be difficult for users. Instead, demonstrate querying land cover using a region name (e.g., city, county, or ZIP code). Show how an LLM API with function calling converts the region name into structured geographic coordinates (longitude and latitude defining a bounding box), ensuring consistent outputs for visualization and analysis.
[10 minutes] Responsible AI Considerations
Discuss that LLMs can produce hallucinations (confident but incorrect outputs). While benchmarks (e.g., question answering or reasoning tests) provide snapshots of model performance, they are limited to specific datasets and do not guarantee accuracy in real-world use. Users may issue queries that differ significantly from benchmark scenarios.
Key principles for responsible AI design:
- Constrain outputs & keep designs purposeful: In this use case, the LLM is only used to interpret region names, with outputs restricted to structured geographic coordinates. Use LLMs only where they add clear value, keeping the system simple and useful.
- Transparency: Display maps and coordinates so users can verify results, understand model behavior, and detect potential errors.
- Logging & reproducibility: Record system inputs and outputs to enable debugging, auditing, and analysis of failure cases.